Background
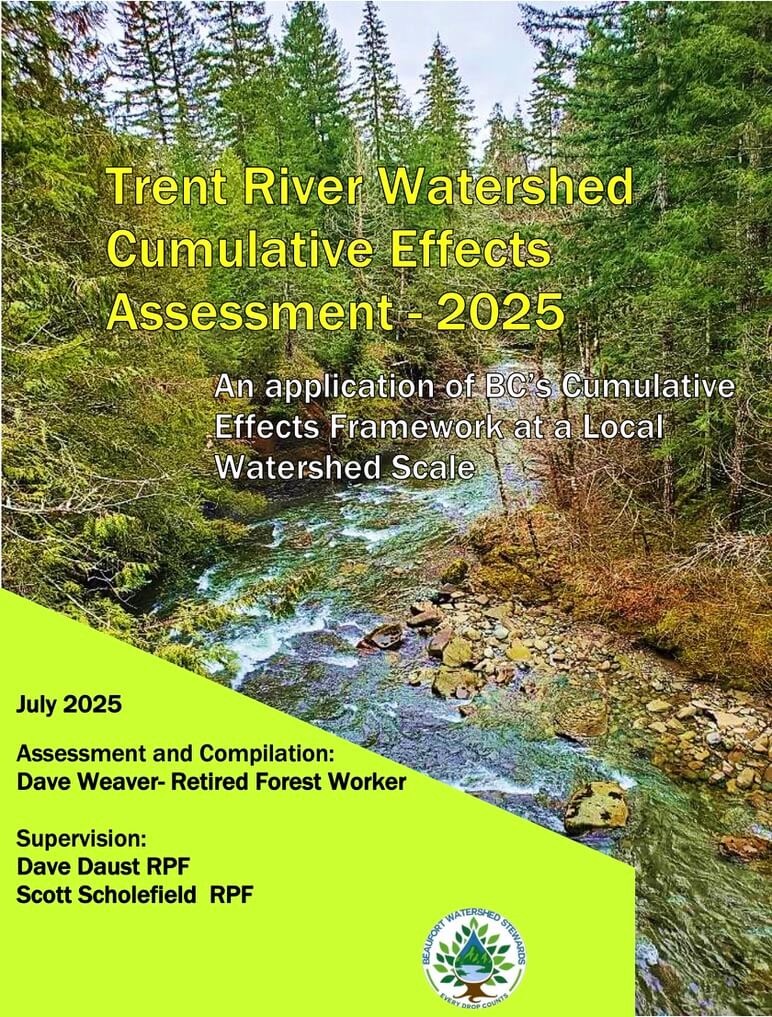
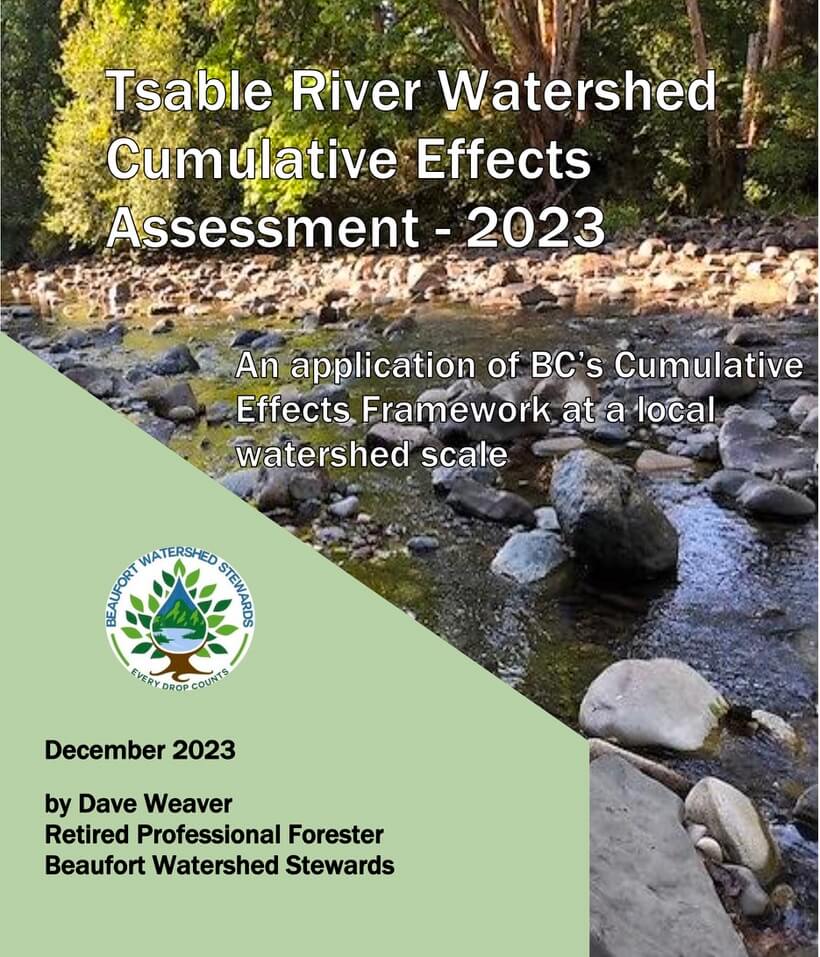
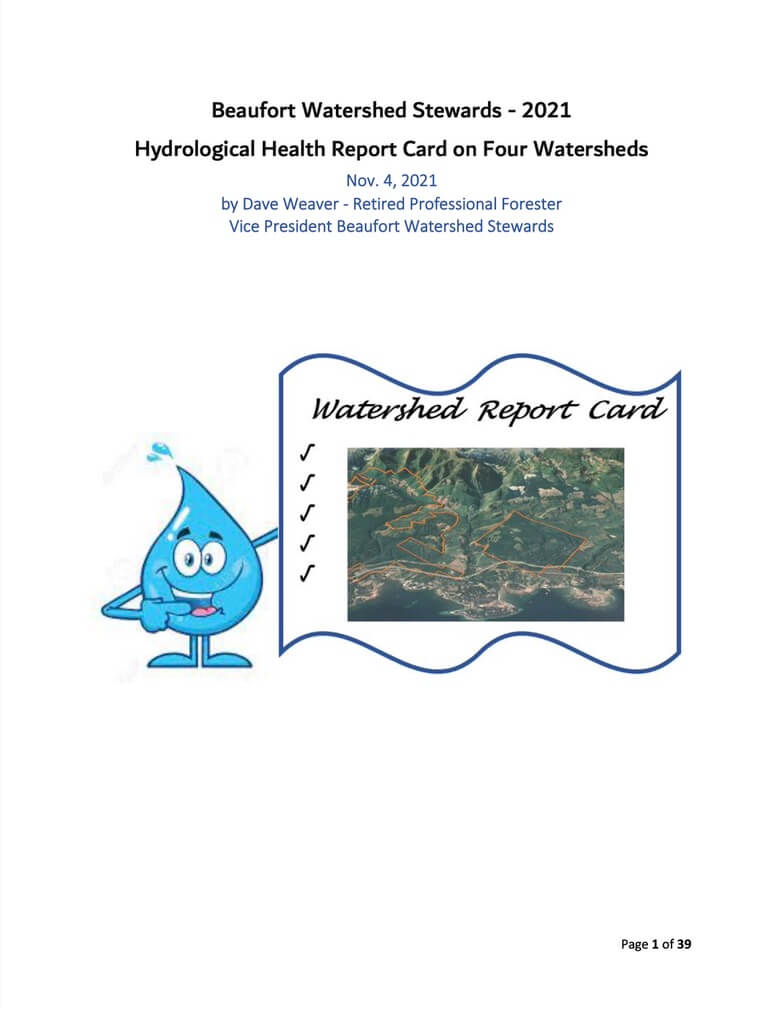
This article summarizes the findings of three assessments conducted on the unceded traditional territory of the K’ómoks, Pentlatch and Qualicum First Nations along the eastern slopes of the Beaufort Mountain Range. The assessments & compilation of the reports were conducted by Dave Weaver, retired forest worker; the preparation of the Trent River Watershed Report was supervised by Dave Daust, RPF & Scott Scholefield, RPF.
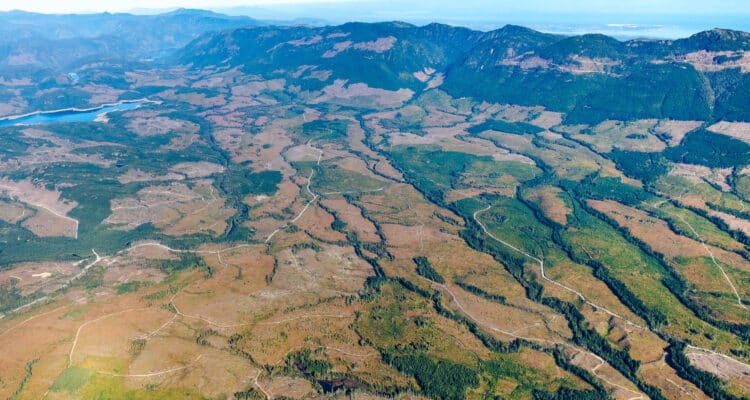
This photo by TJ Watt (2022) shows the extent of forest harvesting on the western slopes of the Beaufort Range. Under the current Private Managed Forest Land Act, this is fully legal.
Watersheds Assessed
Cowie, Wilfred, Waterloo and Mud Ck. Watersheds were assessed in 2021 (1). Tsable R. watershed was assessed in 2024 (2), and the Trent R. watershed in 2025 (3). A total of 24,600 ha were assessed over four years–a connected landscape of watersheds from Royston to Deep Bay.
Risk of Negative Impact Hydrological & Aquatic Ecosystem Function
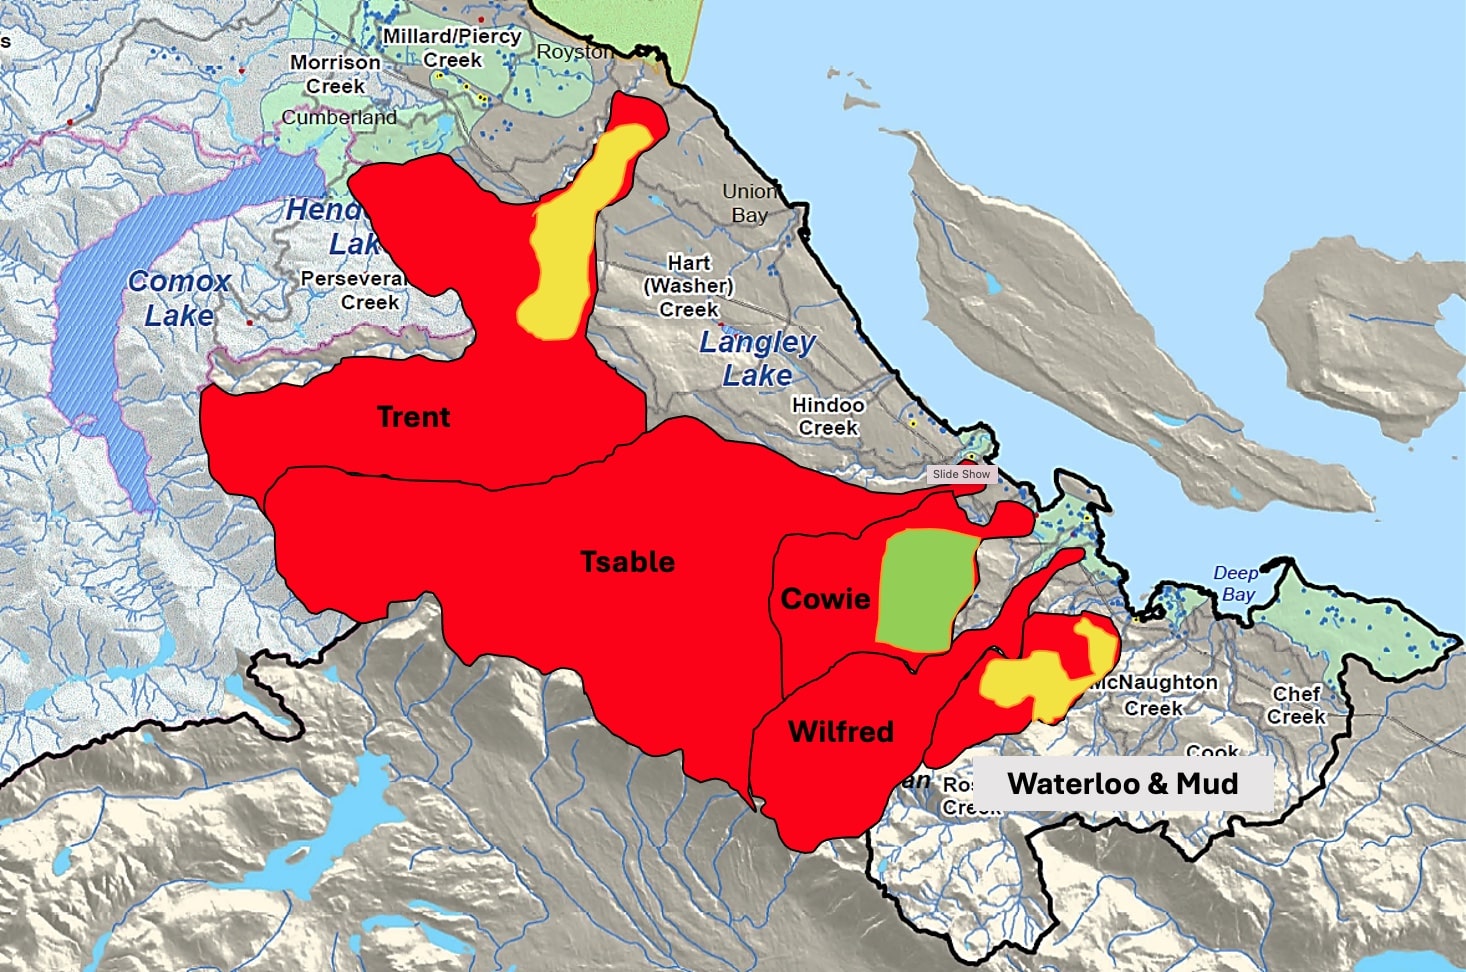
“Ecological risk assessment evaluates the chance that management activities (e.g., forest harvesting, road networks), in combination with natural disturbance (e.g., wildfire, insect outbreaks), will have important impacts on ecological function, biodiversity or local species.”(4). High Risk rating recommends in-depth detailed Professional Watershed Assessment to confirm the Risk rating, but further management activies are recommended to be paused in the interim. RED = High Risk, YELLOW = Moderate Risk, GREEN = Low Risk.
Methods
The Tsable and Trent assessments were conducted with the updated 2020 cumulative effects assessment (5), released by the Province of BC. The original (2001, 6) protocol was used for Cowie, Wilfred, Waterloo and Mud Watersheds. Cumulative effects assessment has six core indicators: road density, road density <100m from stream-aquatic habitat, road density <100m from stream-water quality, road density on unstable slopes, stream crossing density, riparian disturbance, and peak flow. Road density and peak flow where the most influential indictors of watershed function. The map reflects road density indicator risk. All the areas rated high (red) on the map are Private Managed Forest land. The yellow and green are Public Managed Forests.
Conclusions
- Four watersheds had a high-risk of hydrological and aquatic ecosystem dysfunction at the time of assessment.
- The assessed risk is higher on Private Managed Forest Land than on Public Managed Forest Land.
- Local governments, stewardship groups and citizens need to advocate for Private Managed Forest legislation changes.
Reports
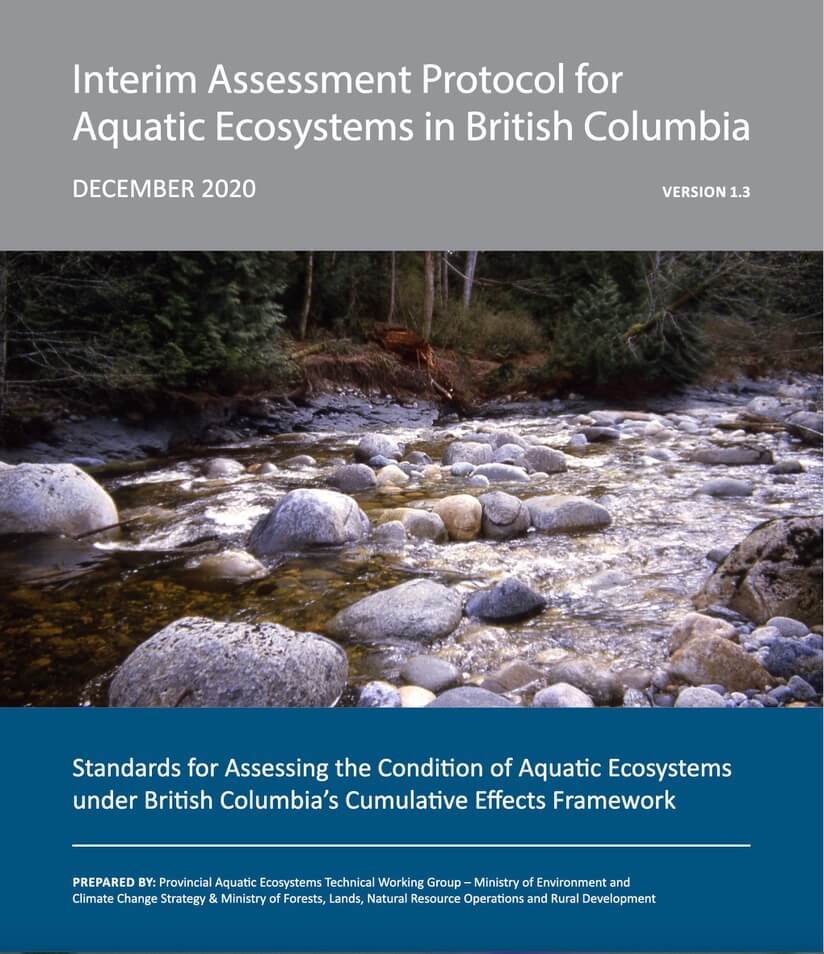
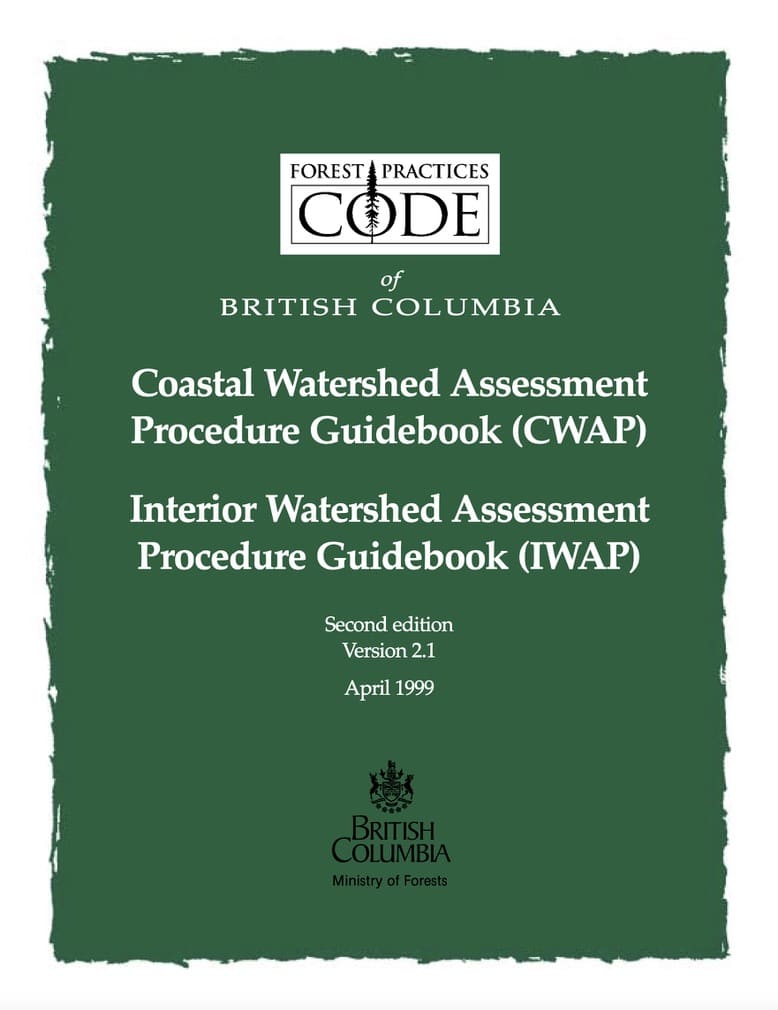
Click on report image to access full document.